Tutorial: Grid Search with AENET + mapper
This tutorial explains how to comprehensively evaluate the energy surface of an N2 dimer by combining a machine learning potential built with AENET and the mapper (grid search) algorithm in ODAT-SE.
The sample files are located in sample/aenet_mapper/.
Prerequisites
AENET’s
predict.xmust be installedA trained ANN potential file (
N.5t-5t.ann) must be prepared (see Tutorial: AENET Training Pipeline)
File Structure
sample/aenet_mapper/
├── input.toml             # ODAT-SE configuration file
├── predict.in             # AENET prediction settings
├── template.xsf           # Structure template
├── run_all.sh             # Execution script
└── plot_colormap.py       # Distance-energy curve plot
Description of input.toml
[base]
dimension = 1
output_dir = "output"
Sets the dimension of the parameter space to 1 (N-N bond distance only).
[solver]
name = "aenet"

[solver.config]
aenet_exec_file = "predict.x"
aenet_ann_potential = "N.5t-5t.ann"

[solver.param]
string_list = ["value_01"]
Specifies AENET as the solver, along with the path to predict.x and the ANN potential file.
string_list defines the placeholders in the template.
[algorithm]
name = "mapper"
label_list = ["z"]

[algorithm.param]
min_list = [0.8]
max_list = [1.4]
num_list = [101]
Mapper algorithm settings:
Parameter |
Description |
|---|---|
|
Search range: N-N distance 0.8 to 1.4 Angstrom |
|
Number of grid points: 101 (equally spaced, step size 0.006 Angstrom) |
Template File
template.xsf is the structure template for the N2 dimer:
ATOMS
N             0.0000000000        0.0000000000        0.0000000000
N             0.0000000000        0.0000000000        value_01
value_01 is the N-N bond distance, which mapper evaluates at equally spaced points in the range of 0.8 to 1.4 Angstrom.
How to Run
Using the execution script:
cd sample/aenet_mapper
sh run_all.sh
Or run directly:
odatse-aenet input.toml
The grid search with 101 points completes in about 1 second in serial execution.
Output
The calculation results are generated in the output/ directory:
output/ColorMap.txt: Table of N-N distances and corresponding energies at each grid point
Format of ColorMap.txt:
# z  fx
0.800000  <energy>
0.806000  <energy>
...
The first column is the N-N distance (Angstrom) and the second column is the energy (eV/atom).
Visualization of Results
You can plot the distance-energy curve using plot_colormap.py:
python3 plot_colormap.py
This generates distance_energy.png.
Results
The grid search results show that the energy minimum occurs at an N-N bond distance of approximately 1.1 Angstrom.
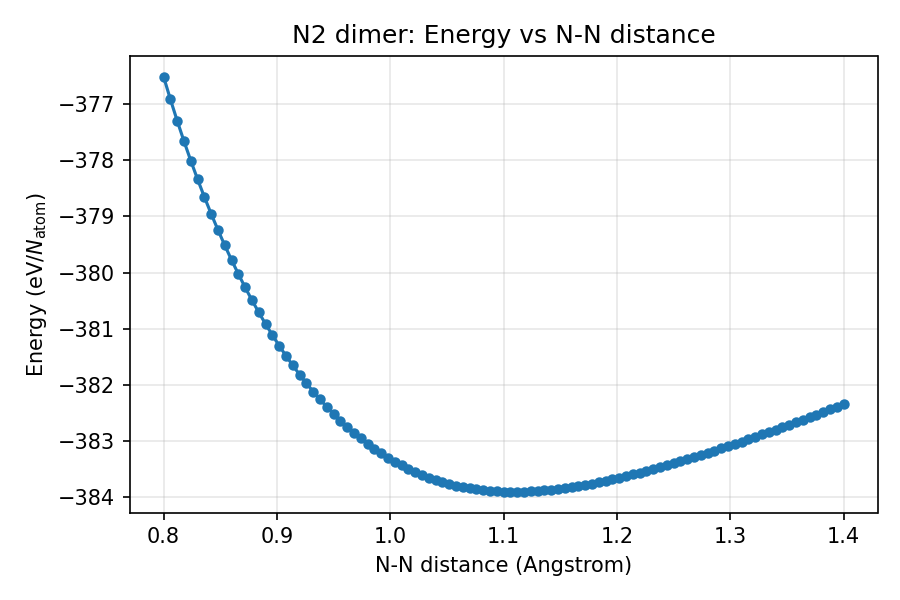
Distance-energy curve of the N2 dimer (grid search results by mapper)
To find the grid points with the lowest energy:
sort -k2 -n output/ColorMap.txt | head -5
1.106000 -383.911050
1.112000 -383.910955
1.100000 -383.908373
1.118000 -383.908224
1.124000 -383.902987
The energy minimum is at z = 1.106 Angstrom.